Sky Viewer
Sky Viewer is an advanced astronomical visualization platform based on Aladin Lite v3. The system was designed for displaying HiPS (Hierarchical Progressive Surveys) images and overlaying catalogs from multiple data sources.
Similarly to Target Viewer, Sky Viewer was originally developed within the scope of the DES (Dark Energy Survey) project. Its predecessor version remains accessible through the DES Science Server, providing legacy access to DES DR2 data. The current iteration, architected to integrate with the IDAC-Brazil service portfolio, is a flexible solution offering differentiated access levels: public data intended for the general community and embargoed data (such as LSST) restricted to duly authenticated members.
Control Panel for Local Data
Located on the right side of the interface.
This panel serves as the central manager for data hosted at LIneA, filtering access according to user credentials.
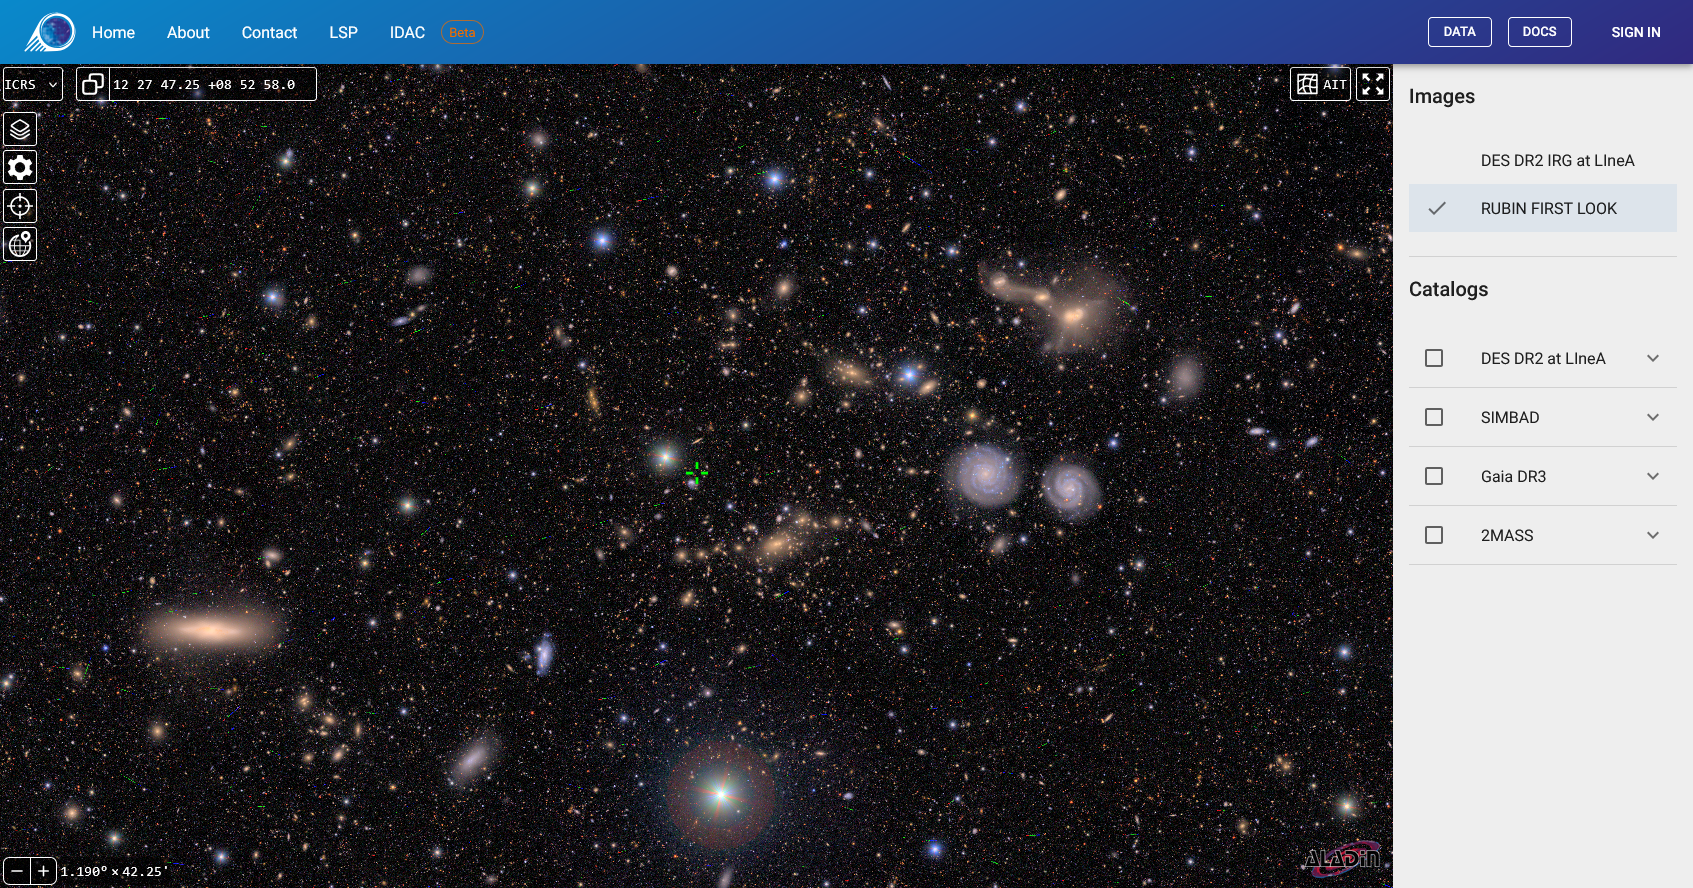
1.1 Images Section (Background)
This section lists the HiPS surveys available locally for use as background images.
Restricted Access: Unauthenticated users will see only public surveys. After the sign-in procedure, members of specific collaborations (such as LSST) will have access to additional options restricted to their respective working groups.
1.2 Catalogs Section (Overlays)
Displays the list of tabular catalogs (HiPScat) available locally for overlay.
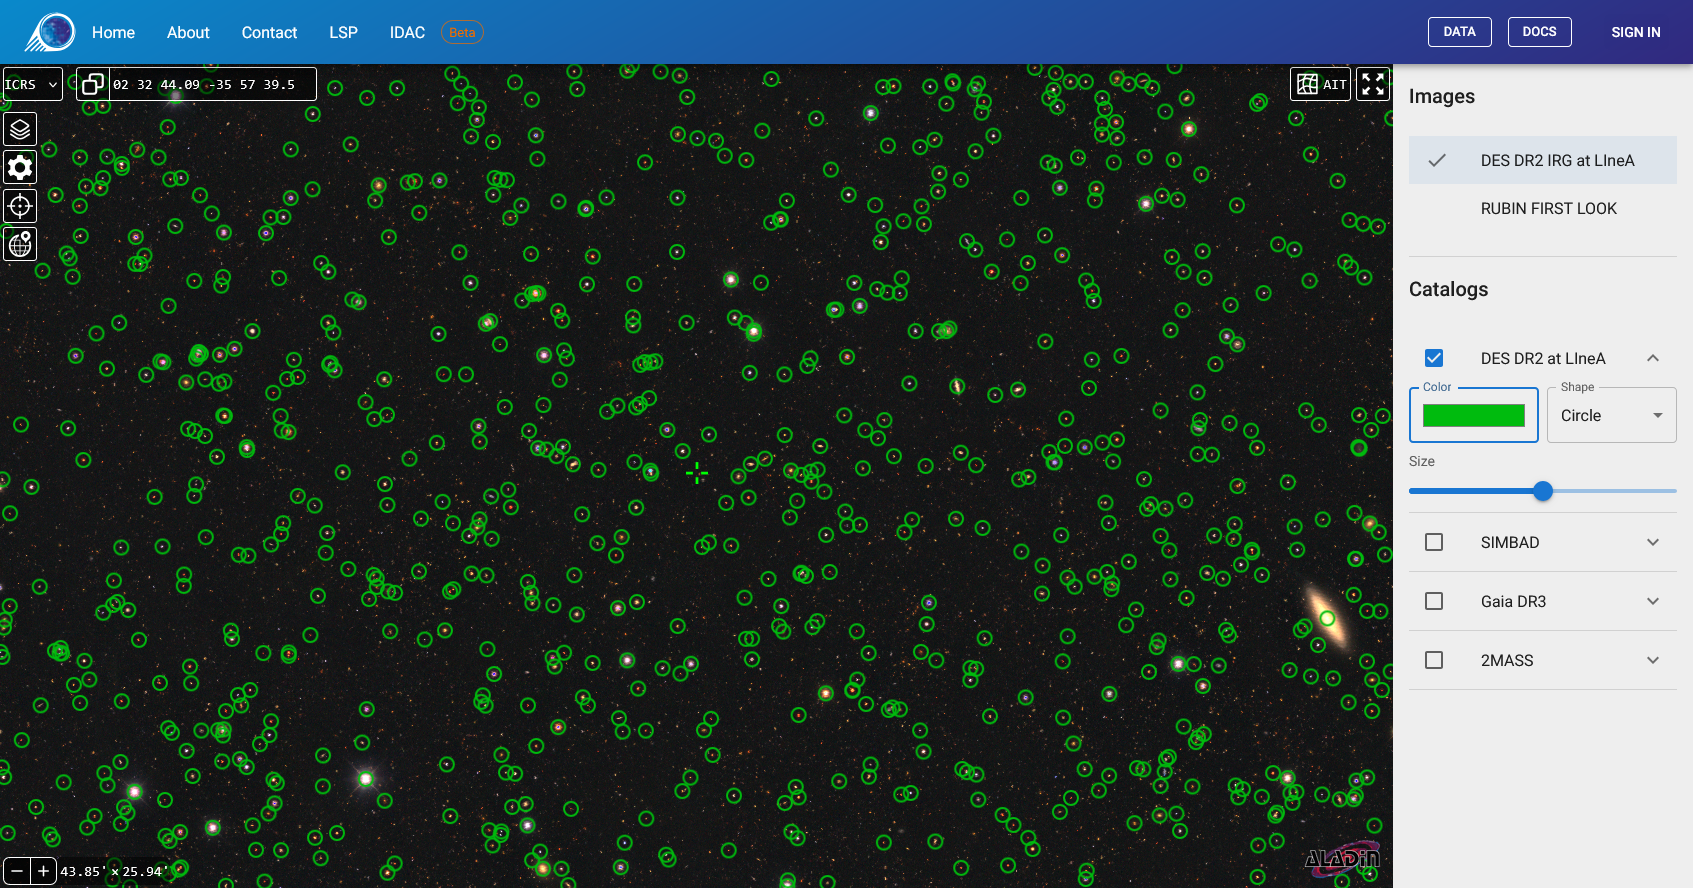
Visualization: Activation of a catalog is performed by checking the corresponding checkbox.
Customization: By clicking on the arrow (▼) adjacent to the catalog name, the visualization controls expand:
- Color: Defines the marker coloring, facilitating distinction between multiple catalogs.
- Shape: Changes the geometric morphology of the markers (circle, square, cross, among others).
- Size: Adjusts the point size in pixels.
Data Available at LIneA
| Dataset Name | Type | Access | Technical Description |
|---|---|---|---|
| DES DR2 | Image & Catalog | Public | Dark Energy Survey Data Release 2 (Optical Spectrum). |
| Rubin First Look | Image | Public | Initial public images from Rubin Observatory. |
| LSST DP0.2 | Image | Restricted | Data Preview 0.2 (Simulation). Exclusive to members. |
| LSST DP1 | Image & Catalog | Restricted | Data Preview 1. Restricted to development environments and authorized members. |
Standard Aladin Lite Interface
Native menus and toolbars of the application. These tools govern the data visualization mode, provide navigation and spatial reference resources, and are fundamental to the user experience.
2.1 Search Bar (Top)
Enables navigation to a specific position through two methods:
- By Coordinates: Accepts decimal or sexagesimal formats (e.g., 13 25 27.6 -43 01 09).
- By Object Name: Allows entry of the identifier (e.g., NGC 4755). The system queries the Sesame service (CDS) to resolve the coordinates and center the map on the object.
2.2 Layer Manager (Stack Icon - Top Left)
While the right panel is intended for more direct management of HiPS image display and local catalogs, this menu provides access to an extensive collection of remote public catalogs hosted by the CDS.
- Overlays: Allows selection of catalogs or even searching for other catalogs to display as a layer over survey images. Local catalog databases are also displayed in this list.
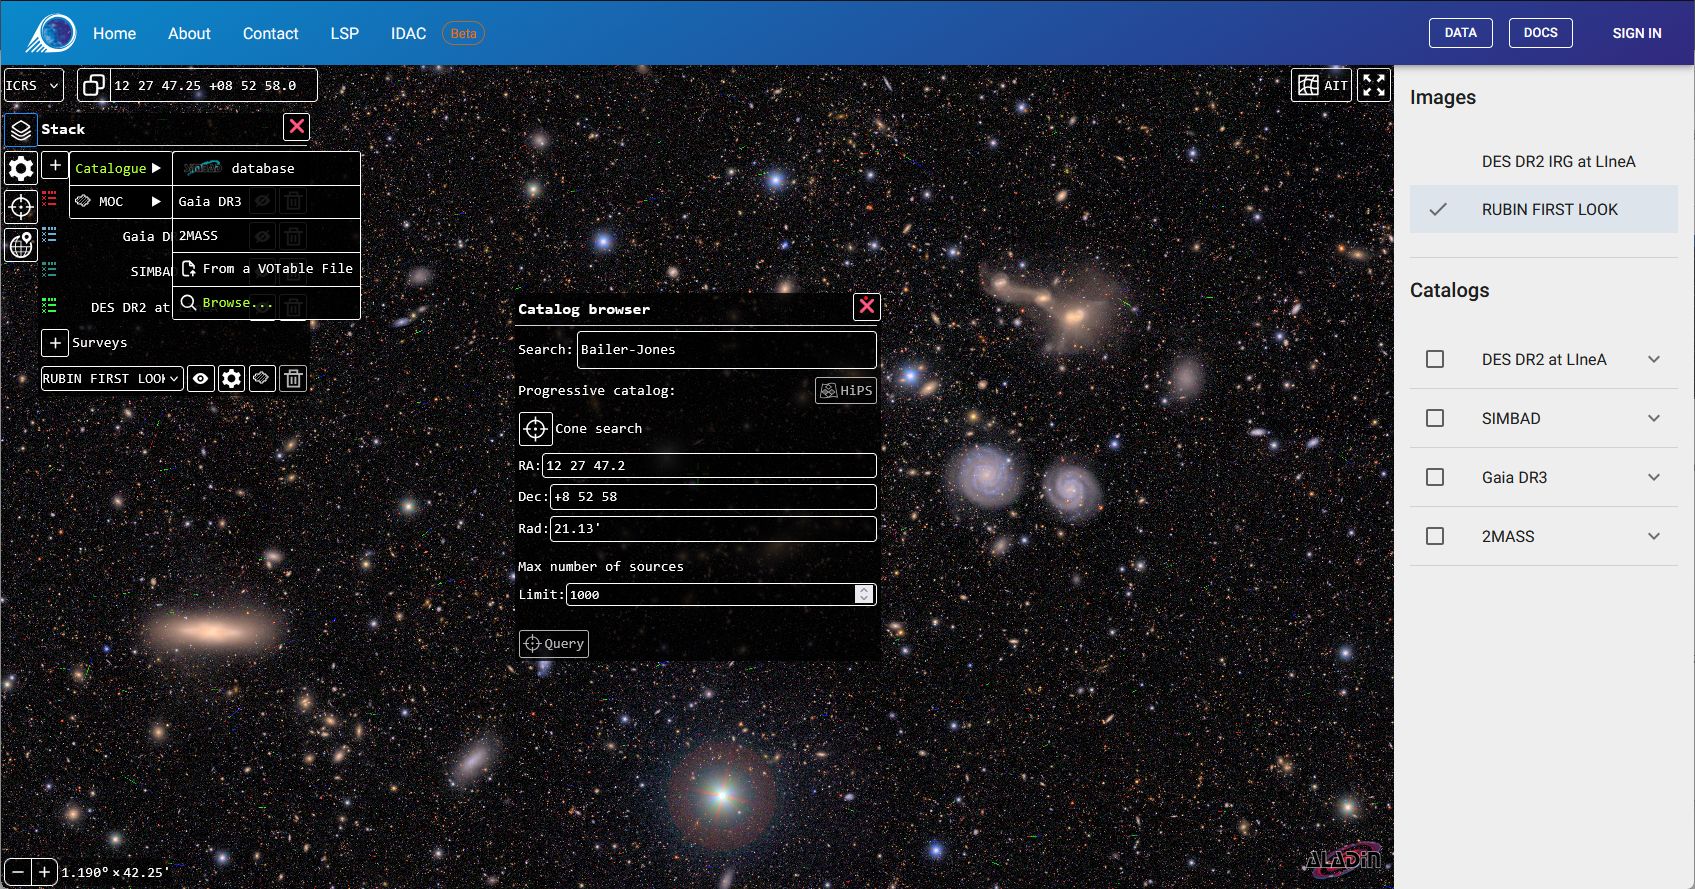
- Surveys: Intended for selection and management of image layers available on remote servers. Local HiPS images are also displayed in this list.
- Contrast: Controls for adjusting brightness, saturation, contrast, and gamma of the displayed image.
- Opacity: Allows creation of visual compositions by adjusting the transparency of the background image or overlaid catalogs.
- Colormap: Changes the image color map (e.g., Rainbow, Heatmap, Grayscale), a useful feature for highlighting intensity variations in monochromatic images.
- Cutout: Controls for exporting snapshots and stretch type (contrast enhancement model) of images.
2.3 Visualization Settings (Gear Icon)
- Coordinate Grid: Overlays the Right Ascension and Declination lines.
- Reticle: Displays a fixed central crosshair, essential for precise identification of the coordinate at the center of the field of view.
- HEALPix Grid: Displays the data tessellation grid, useful for technical inspection of image quality.
2.4 Reference Systems and Projections
Located in the bottom bar or in the settings menu:
Coordinate Frame (Reference Systems)
Allows selection of the astronomical reference frame for map orientation and coordinate grid. The available options are:
- ICRS: International Celestial Reference System. Default configuration that uses equatorial coordinates (J2000) with sexagesimal representation (hours, minutes, seconds).
- ICRSd: Variation of the ICRS system that displays equatorial coordinates in decimal degree format, facilitating direct reading of numerical values for quantitative analysis.
- GAL: Galactic Coordinate System. Reorients the visualization with the Milky Way disk as the fundamental plane, ideal for studies of galactic structure.
Projection Types
Users can select the map projection geometry that best suits their exploration. Options include:
- Tangential: (gnomonic projection) Projects the sphere from the center onto a tangent plane. This projection has the unique property of representing all great circles (such as meridians and the equator) as straight lines. It is ideal for astrometry in small fields but exhibits severe distortion at the edges in wide fields.
- Stereographic: (stereographic projection) Conformal projection that preserves local angles. Although area is not preserved (scale increases away from the center), the shapes of small objects (such as craters or galaxies) remain true.
- Spheric: The standard "virtual globe" representation, simulating the view of a three-dimensional sphere from a finite distance. It is the most intuitive projection for general navigation.
- Zenital equal-area: (Lambert azimuthal projection) Rigorously preserves object area at the expense of shape. It is fundamental for statistical analyses, such as source counts per square degree or stellar density studies, ensuring that regions of the same size on screen correspond to equal areas in the sky.
- Mercator: Classic conformal cylindrical projection. Preserves local directions and shapes but significantly distorts areas at high latitudes (poles). It is useful for visualizing equatorial regions.
- Hammer-Aitoff: Equal-area projection that displays the entire celestial sphere (All-Sky) in an ellipse. Compared to Mollweide, it produces less severe angular distortions in the outer regions, making it excellent for complete galactic distribution maps.
- Mollweide: Pseudocylindrical equal-area projection, frequently used for global maps of the celestial sphere, such as cosmic microwave background radiation maps or Milky Way stellar density maps. Parallels are straight lines, while meridians are ellipses.
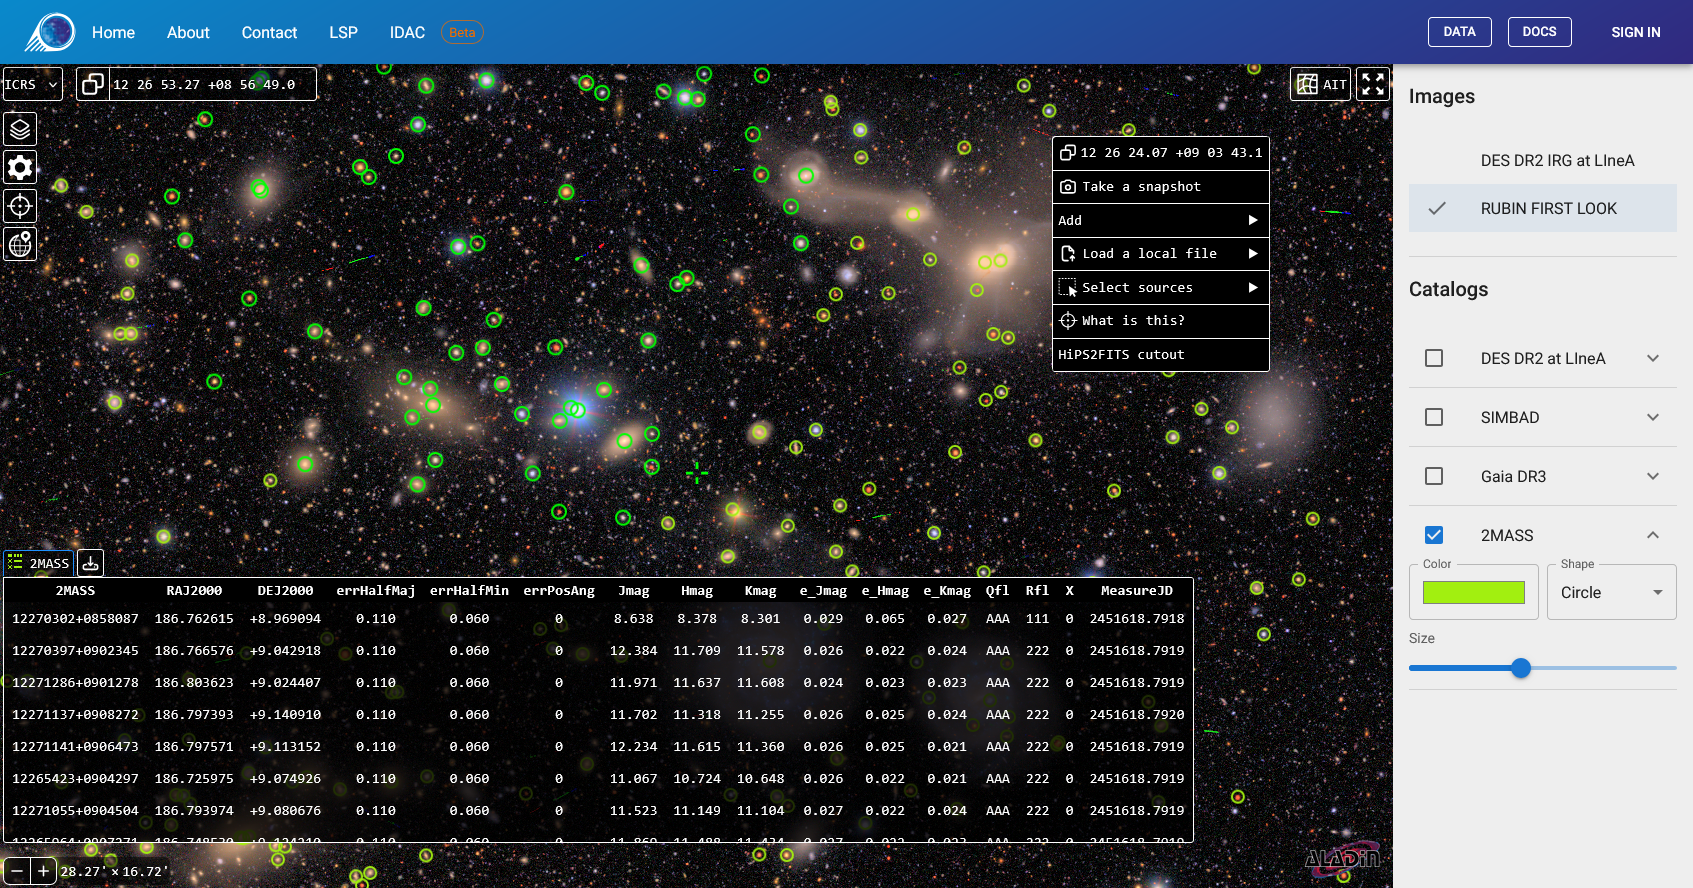
Context Menu
Accessible via right-click on the map.
The context menu provides immediate shortcuts and exclusive analytical tools. Some functionalities complement the aforementioned resources, while others offer distinct capabilities.
3.1 Identification and Coordinates
- What is this?: Executes a radial query in the SIMBAD database based on the click position, returning the list of cataloged objects in the region.
- Copy Coordinates: Immediately copies the coordinates (RA/Dec in the ICRS system) of the selected point to the clipboard.
3.2 Data Export
- Take a snapshot: Generates a visual image (WebP) faithful to the on-screen display. Ideal for presentations and illustrations. Visual customization of the image should be performed in the survey layer manager (cutout).
- HiPS2FITS cutout: Function currently unavailable.
3.3 Selection Tools (for Catalogs)
Allow visual filtering of data from a loaded catalog.
- Select sources > Rectangular / Circular / Polygon: The user defines a region on the map. The system will select all catalog sources contained within the delimited geometry and filter the corresponding data table in the lower panel. This selected subset can be downloaded as a CSV file.
3.4 Local Import
- Load a local file: Allows loading of data stored locally on the user's computer for comparison with server data.
- Catalogs: CSV or VOTable files (require RA/Dec columns).
- Images: FITS files with valid WCS.